Go 监控告警入门 Opentelemetry
探索 Go 语言中 Opentelemetry 与 Prometheus 集成,导出 HTTP 服务指标监控,并最终将 Prometheus 指标可视化到 Grafana 中。
前言
Opentelemetry
分布式链路跟踪( Distributed Tracing )的概念最早是由 Google 提出来的,发展至今技术已经比较成熟,也是有一些协议标准可以参考。目前在 Tracing 技术这块比较有影响力的是两大开源技术框架:Netflix 公司开源的 OpenTracing 和 Google 开源的 OpenCensus。两大框架都拥有比较高的开发者群体。为形成统一的技术标准,两大框架最终磨合成立了 OpenTelemetry 项目,简称 otel。otel 有链路追踪和监控告警两大块,关于监控告警,可以查看另一篇文章:Go 链路追踪入门 Opentelemetry
Prometheus
Prometheus 源自 SoundCloud,拥有一整套开源系统监控和警报工具包,是支持 OpenTelemetry 的系统之一,是 CNCF 的第二个项目。
Grafana
Grafana 是一个开源的分析和可视化平台,它允许你查询、可视化和警报来自各种数据源的数据。它提供了一个用户友好的界面,用于创建和共享仪表板、图表和警报。Grafana 支持广泛的数据源,其中就包括 Prometheus

基础概念
这里为了简单入门,尽量简单的介绍一些抽象概念,结合着代码理解,如果不能理解也没关系,代码写着写着自然就明白了:
Meter Provider
用于接口化管理全局的 Meter 创建,相当于全局的监控指标管理工厂。
Meter
用于接口化创建并管理全局的 Instrument,不同的 Meter 可以看做是不同的程序组件。
Instrument
用于管理不同组件下的各个不同类型的指标,例如 http.server.request.total
Measurements
对应指标上报的具体的 DataPoint 指标数据,是一系列的数值项。
Metric Reader
用于实现对指标的数据流读取,内部定义了具体操作指标的数据结构。OpenTelemetry 官方社区提供了多种灵活的 Reader 实现,例如 PeridRader、ManualReader 等。
Metric ExporterExporter 用于暴露本地指标到对应的第三方厂商,例如:Promtheus、Zipkin 等。
指标类型
OpenTelemetry metrics 有许多不同指标类型,可以把它想象成类似于 int, float 这种的变量类型:
Counter:只增不减的指标,比如 http 请求总数,字节大小;
Asynchronous Counter:异步 Counter;
UpDownCounter:可增可减的指标,比如 http 活动连接数;
Asynchronous UpDownCounter:异步 Counter;
Gauge:可增可减的指标,瞬时计量的值,比如 CPU 使用,它是异步的;
Histogram:分组聚合指标,这个较为难以理解一些,可以移步此处查看,当然,后文也会有一个详细的例子来使用它。
实战:采集指标
废话了一堆,终于可以实战了。我们先以 http 请求总数为例来走一遍整个采集指标流程。安装扩展:
go get github.com/prometheus/client_golang
go get go.opentelemetry.io/otel/exporters/prometheus
go get go.opentelemetry.io/otel/metric
go get go.opentelemetry.io/otel/sdk/metric
打开 main.go,编写以下代码:
package main

import (
	"context"
	"fmt"
	"log"
	"net/http"
	"os"
	"os/signal"

	"github.com/prometheus/client_golang/prometheus/promhttp"
	"go.opentelemetry.io/otel/exporters/prometheus"
	api "go.opentelemetry.io/otel/metric"
	"go.opentelemetry.io/otel/sdk/metric"
)

const meterName = "oldme_prometheus_testing"

var (
	requestHelloCounter api.Int64Counter
)

func main() {
	ctx := context.Background()

	// 创建 prometheus 导出器
	exporter, err := prometheus.New()
	if err != nil {
		log.Fatal(err)
	}

	// 创建 meter
	provider := metric.NewMeterProvider(metric.WithReader(exporter))
	meter := provider.Meter(meterName)

	// 创建 counter 指标类型
	requestHelloCounter, err = meter.Int64Counter("requests_hello_total")
	if err != nil {
		log.Fatal(err)
	}

	go serveMetrics()

	ctx, _ = signal.NotifyContext(ctx, os.Interrupt)
	<-ctx.Done()
}

func serveMetrics() {
	log.Printf("serving metrics at localhost:2223/metrics")
	http.Handle("/metrics", promhttp.Handler())

	http.Handle("/index", http.HandlerFunc(func(w http.ResponseWriter, r *http.Request) {
		// 记录 counter 指标
		requestHelloCounter.Add(r.Context(), 1)

		_, _ = w.Write([]byte("Hello, Otel!"))
	}))

	err := http.ListenAndServe(":2223", nil) //nolint:gosec // Ignoring G114: Use of net/http serve function that has no support for setting timeouts.
	if err != nil {
		fmt.Printf("error serving http: %v", err)
		return
	}
}
在我们的代码中,我们定义一个名字为 requests_hello_total 的 Int64Counter 指标类型,Int64Counter 代表这是一个只增不减的 int64 数值,用作记录请求总数正好合适。运行我们的程序,如果不出错的话,访问 http://localhost:2223/index 可以看到 Hello, Otel!。并且我们访问 http://localhost:2223/metrics 可以看到指标数据:
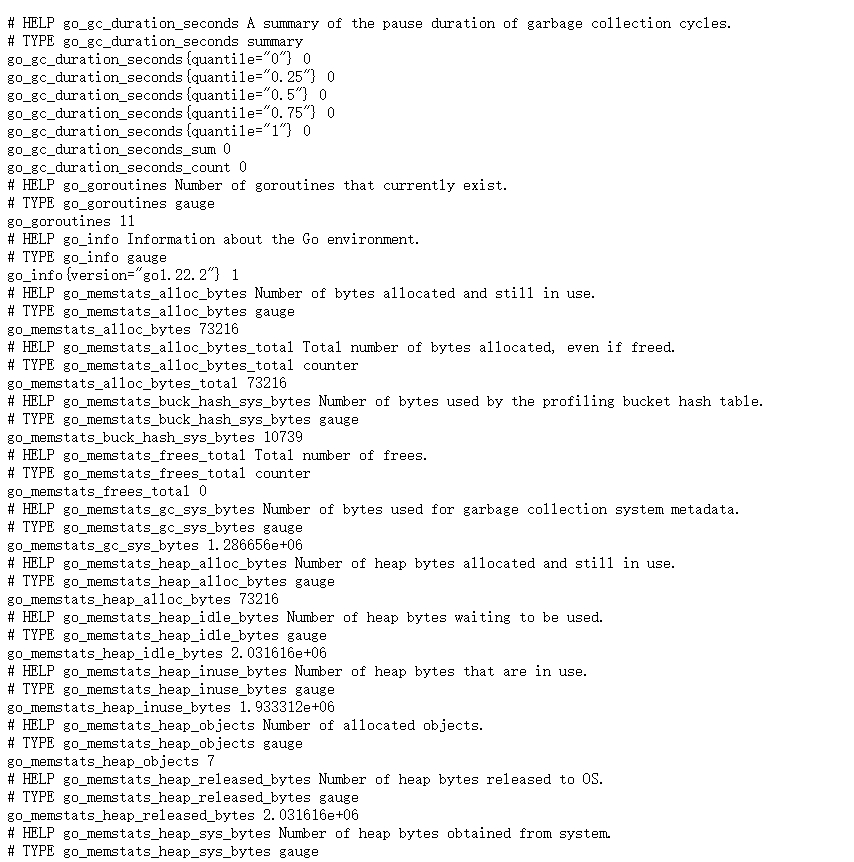
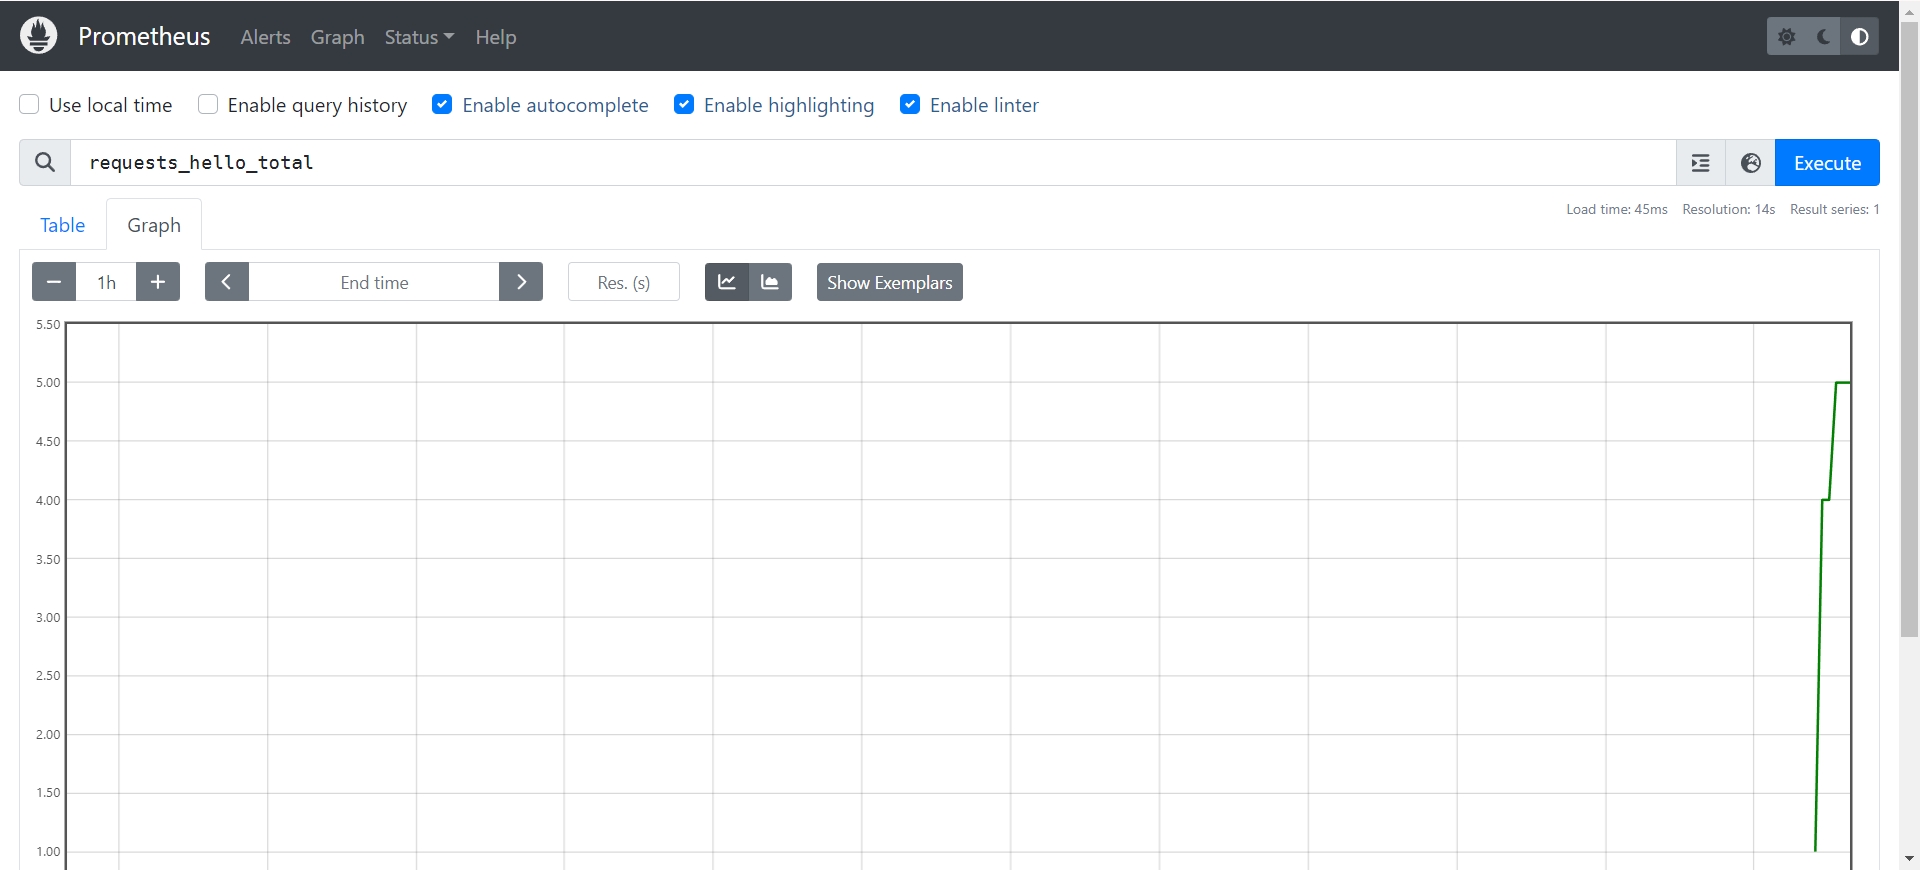
这里数据还没有进行可视化,我们先把流程走通,多访问几次 http://localhost:2223/index 可以看到 requests_hello_total 会增加:

Histogram
接下来我们采集一下 Histogram 指标,统计在 0.1, 0.2, 0.5, 1, 2, 5 秒以内的 http 请求数,在 main.go 中加上相关代码,可以直接复制过去:
package main

import (
	"context"
	"fmt"
	"log"
	"math/rand"
	"net/http"
	"os"
	"os/signal"
	"time"

	"github.com/prometheus/client_golang/prometheus/promhttp"
	"go.opentelemetry.io/otel/exporters/prometheus"
	api "go.opentelemetry.io/otel/metric"
	"go.opentelemetry.io/otel/sdk/metric"
)

const meterName = "oldme_prometheus_testing"

var (
	requestHelloCounter      api.Int64Counter
	requestDurationHistogram api.Float64Histogram
)

func main() {
	ctx := context.Background()

	// 创建 prometheus 导出器
	exporter, err := prometheus.New()
	if err != nil {
		log.Fatal(err)
	}

	// 创建 meter
	provider := metric.NewMeterProvider(metric.WithReader(exporter))
	meter := provider.Meter(meterName)

	// 创建 counter 指标类型
	requestHelloCounter, err = meter.Int64Counter("requests_hello_total")
	if err != nil {
		log.Fatal(err)
	}

	// 创建 Histogram 指标类型
	requestDurationHistogram, err = meter.Float64Histogram(
		"request_hello_duration_seconds",
		api.WithDescription("记录 Hello 请求的耗时统计"),
		api.WithExplicitBucketBoundaries(0.1, 0.2, 0.5, 1, 2, 5),
	)
	if err != nil {
		log.Fatal(err)
	}

	go serveMetrics()
	go goroutineMock()

	ctx, _ = signal.NotifyContext(ctx, os.Interrupt)
	<-ctx.Done()
}

func serveMetrics() {
	log.Printf("serving metrics at localhost:2223/metrics")
	http.Handle("/metrics", promhttp.Handler())

	http.Handle("/index", http.HandlerFunc(func(w http.ResponseWriter, r *http.Request) {
		// 记录 counter 指标
		requestHelloCounter.Add(r.Context(), 1)

		// 计算请求处理时间
		startTime := time.Now()
		// 模拟请求处理时间
		time.Sleep(time.Duration(rand.Intn(3)) * time.Second)
		defer func() {
			duration := time.Since(startTime).Seconds()
			requestDurationHistogram.Record(r.Context(), duration)
		}()

		_, _ = w.Write([]byte("Hello, Otel!"))
	}))

	err := http.ListenAndServe(":2223", nil) //nolint:gosec // Ignoring G114: Use of net/http serve function that has no support for setting timeouts.
	if err != nil {
		fmt.Printf("error serving http: %v", err)
		return
	}
}

// 随机模拟若干个协程
func goroutineMock() {
	for {
		go func() {
			// 等待若干秒
			var s = time.Duration(rand.Intn(10))
			time.Sleep(s * time.Second)
		}()
		time.Sleep(1 * time.Millisecond)
	}
}
走到这里,代码层面结束了,已经成功一半了,代码开源在 Github。之后我们就可以安装 Prometheus 服务端和 Grafana 来进行数据可视化。
安装 Prometheus
Prometheus 有多种安装方式,我这里依旧采用 Docker 安装,当然,你也可以使用其他方式安装,具体安装方式可以参考其他文章,后续 Grafana 同理,不在赘述,在 Prometheus.yml 中填写 targets 我们的地址:
scrape_configs:
  - job_name: "prometheus"

    static_configs:
      - targets: ["localhost:2223"]
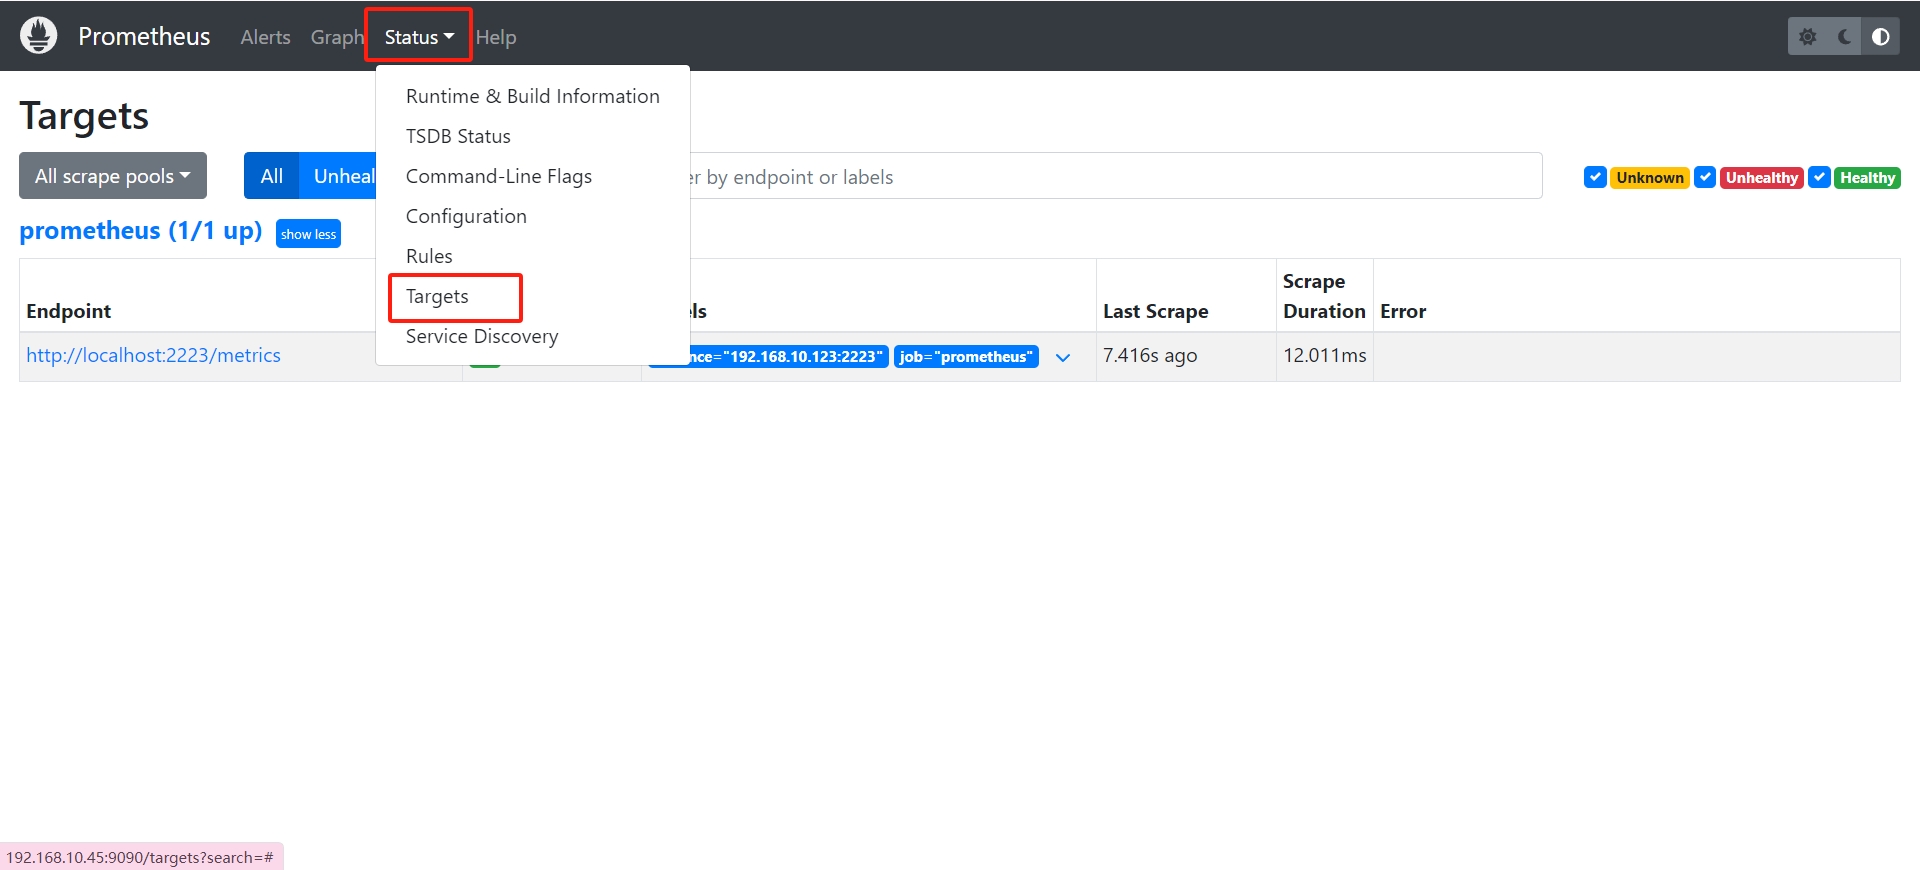
Prometheus 会自动去 {{target}}/metrics 中拉取我们的指标。之后在浏览器打开 Promethues 的地址,例如我的是:http://localhost:9090,如果全部正常的话可以在 status:targets 中看见我们的指标:
在 Promethues 的首页查询 requests_hello_total 指标可以看到可视化的图表:
安装 Grafana
我的 Grafana 安装好了,登录进去后是这样的(我更改过默认颜色):
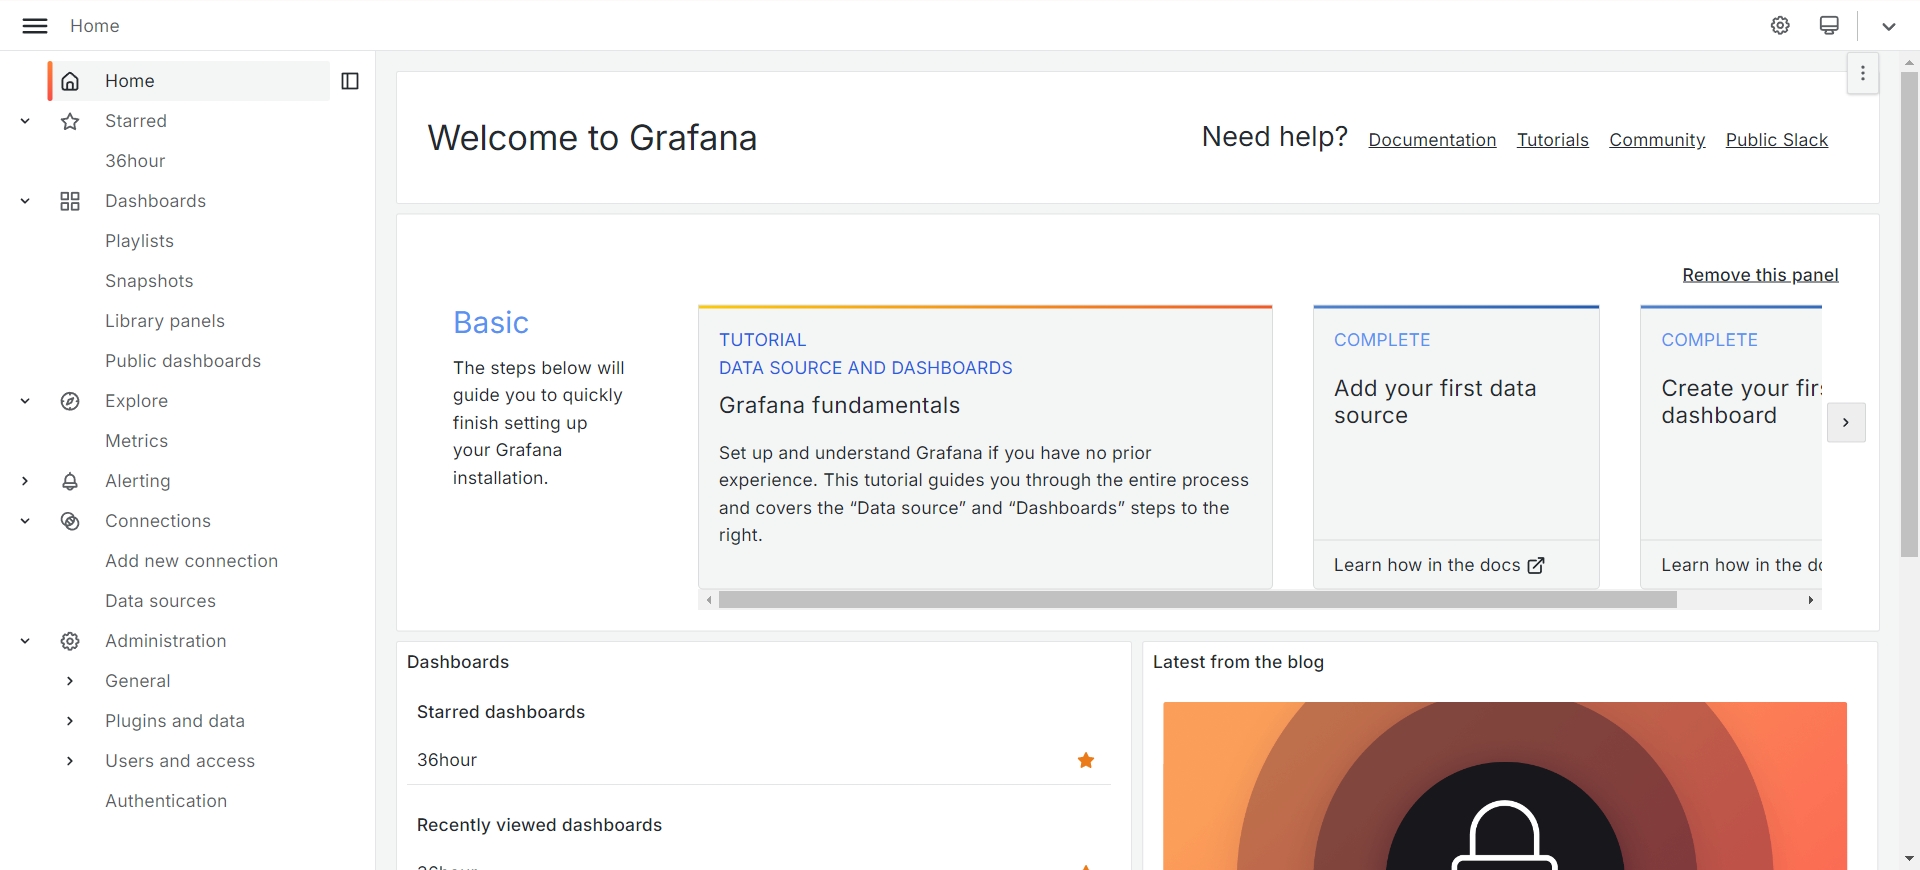
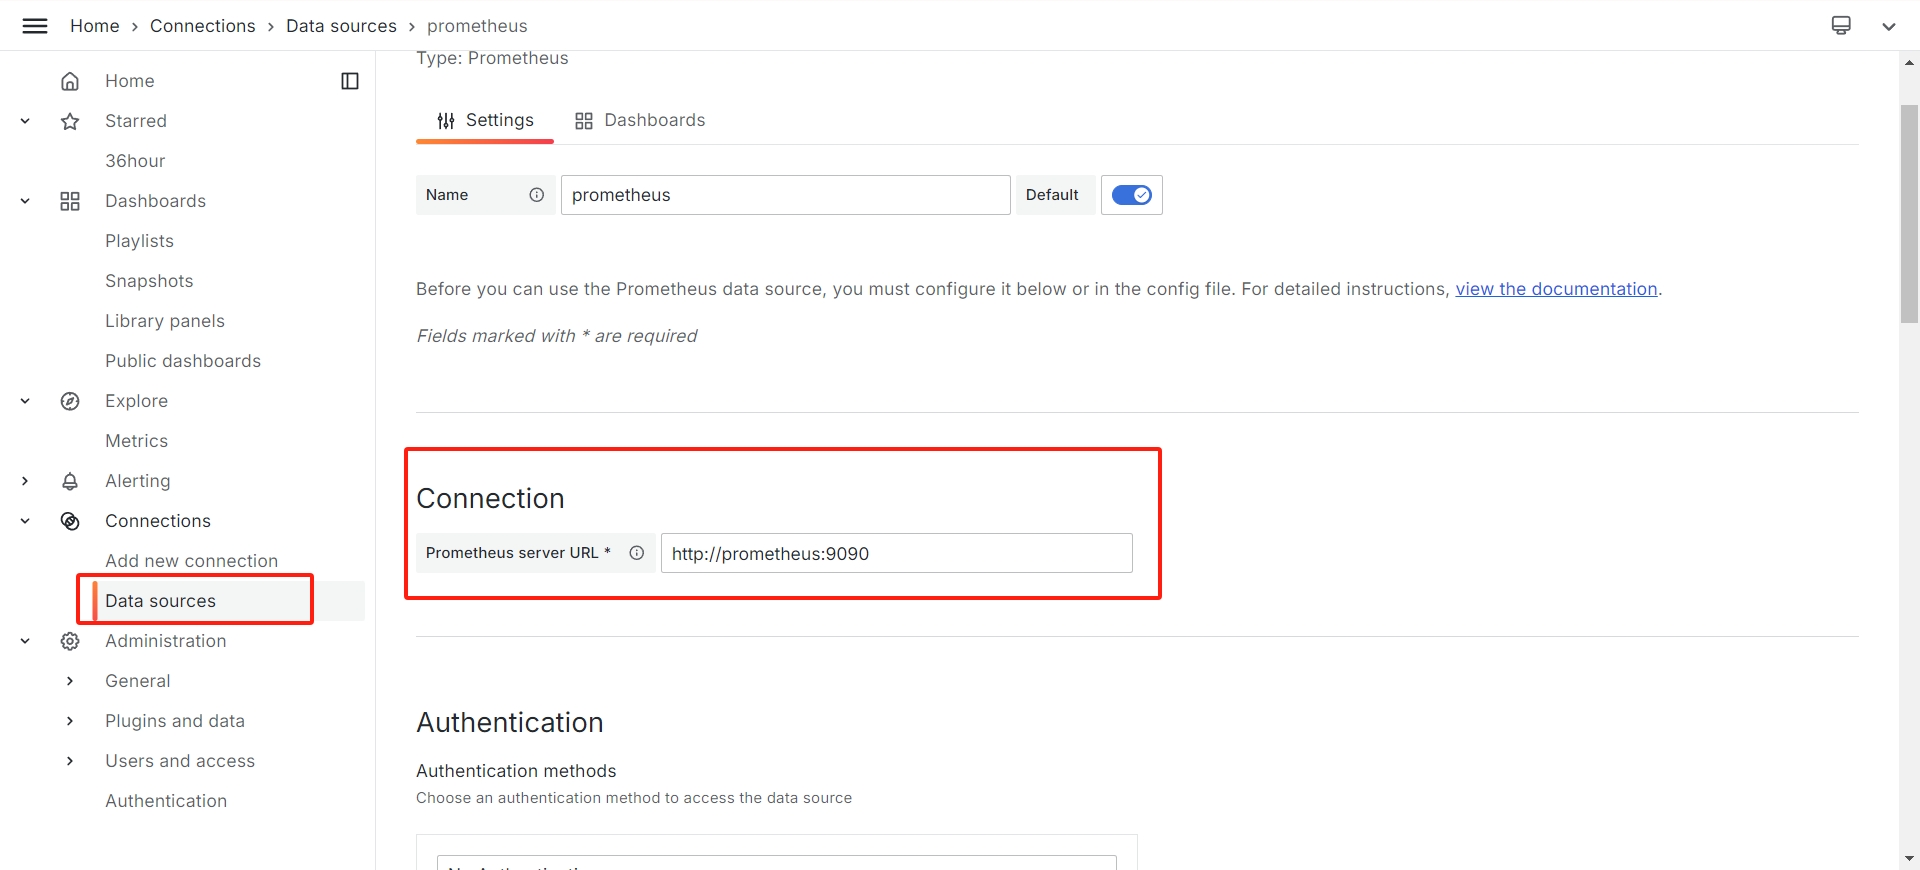
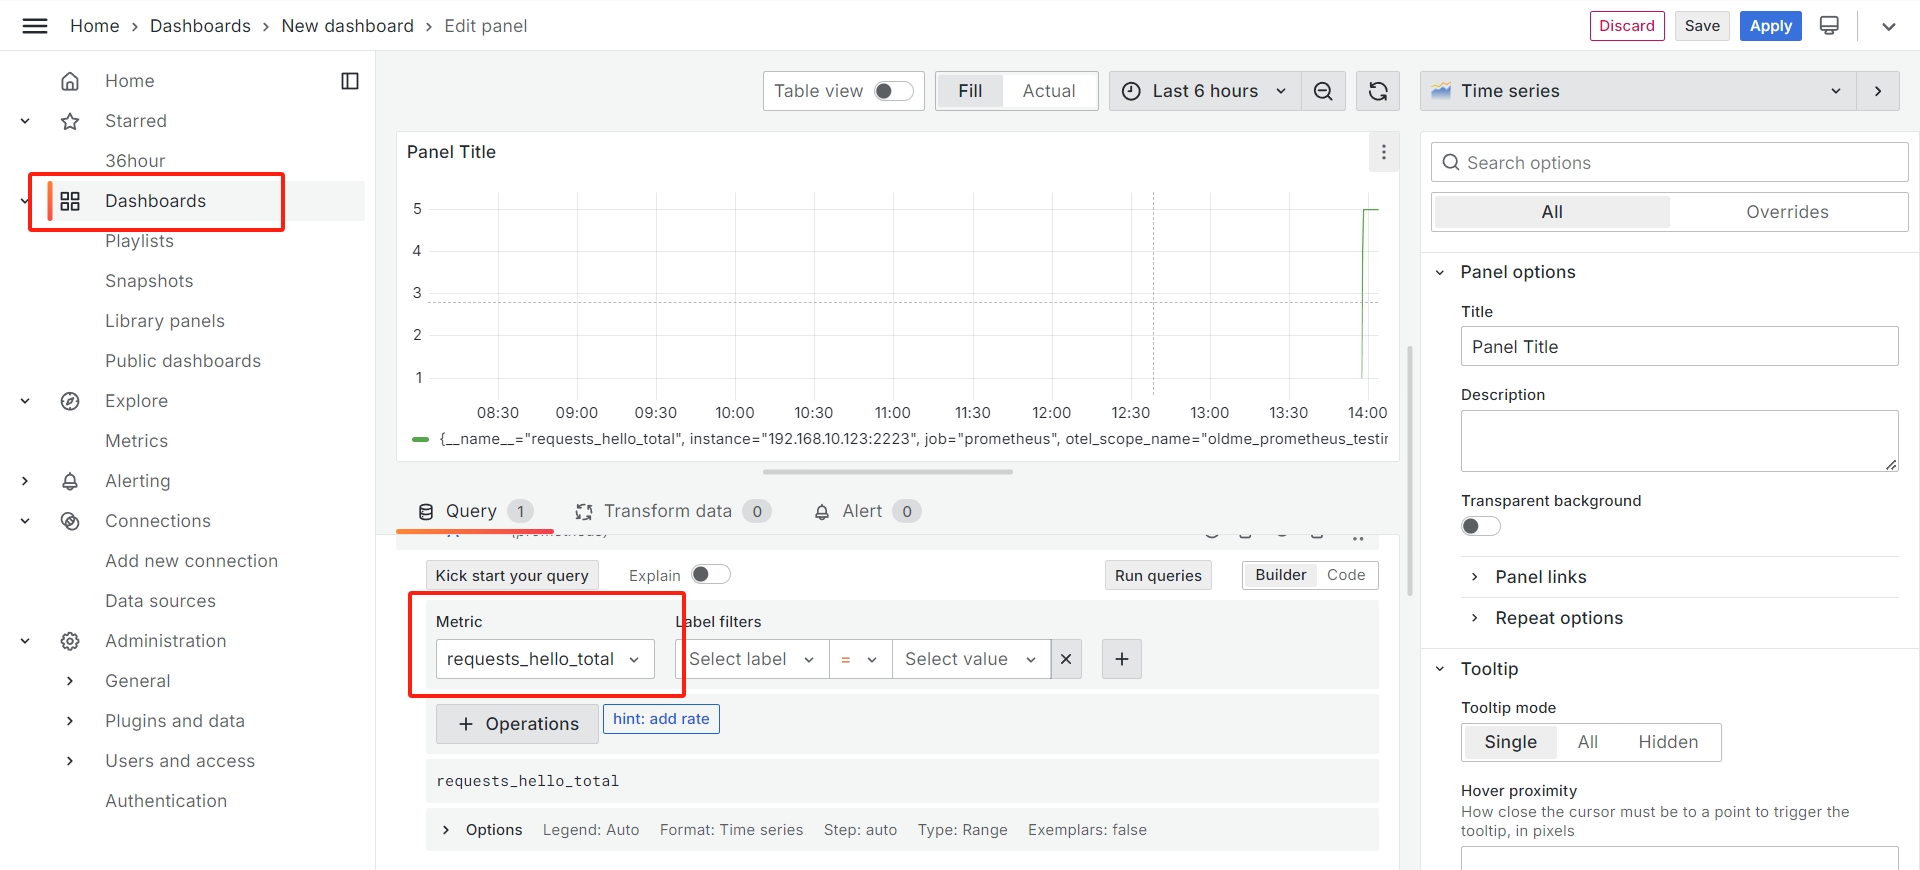
在 Data source 中添加 Prometheus 服务器,然后在 Dashboard 中添加我们想要监控的指标,即可看到更美观的图表:
本文目录