Go pprof 认知到实践
Go pprof 是一种性能分析工具,用于分析程序的性能,包含不限于 CPU 耗时/占用,内存分配,goroutine,锁。
快速开始
测试环境:go version go1.22.2 windows/amd64,源代码开源在 https://github.com/oldme-git/teach-study/tree/master/golang/base/pprof
在正式开始之前,请确保安装 graphviz,这一步不可省略,它可以协助 pprof 生成更直观的数据分析图。可以参考官方网站的安装方法。
go 使用 runtime/pprof 包来对程序进行采样,当然,还有另外一个包 net/http/pprof,这里先按下不表。先来看一个 CPU 分析的例子:
package main

import (
	"math"
	"math/rand"
	"os"
	"runtime/pprof"
)

func main() {
	// 保存 CPU 采样数据
	file := "cpu.pprof"
	os.Remove(file)
	f, err := os.OpenFile(file, os.O_CREATE|os.O_RDWR, 0644)
	if err != nil {
		panic(err)
	}
	defer f.Close()

	// 开始采样
	err = pprof.StartCPUProfile(f)
	if err != nil {
		panic(err)
	}
	defer pprof.StopCPUProfile()

	// 测试程序
	for i := 0; i < 1000; i++ {
		nums := genRandomNumbers(10000)
		for _, v := range nums {
			_ = math.Pow(float64(v), rand.Float64())
		}
	}
}

// 测试程序,生成一个随机数切片
func genRandomNumbers(n int) []int {
	nums := make([]int, n)
	for i := 1; i < n; i++ {
		nums[i] = rand.Int() * n
	}
	return nums
}
这是一个很简单的例子,运行 go run main.go 在当前目录下生成一个 cpu.pprof 文件。然后输入命令 go tool pprof cpu.pprof 进入 pprof 的命令行中。
PS D:\project\teach-study\golang\base\pprof\cpu> go run  main.go
PS D:\project\teach-study\golang\base\pprof\cpu> go tool pprof cpu.pprof
File: main.exe
Build ID: C:\Users\half\AppData\Local\Temp\go-build787417447\b001\exe\main.exe2024-05-08 11:13:12.7105156 +0800 CST
Type: cpu
Time: May 8, 2024 at 11:13am (CST)
Duration: 1.26s, Total samples = 1.07s (85.20%)
Entering interactive mode (type "help" for commands, "o" for options)
(pprof)
pprof 命令有很多,可以输入 help 查看,不过一般常用的就两个: top 和 web。输入 top5 可以查看前 5 的耗时调用。
// 输入
top5

// 输出
Showing nodes accounting for 700ms, 65.42% of 1070ms total
Showing top 5 nodes out of 69
      flat  flat%   sum%        cum   cum%
     210ms 19.63% 19.63%      210ms 19.63%  math.archLog
     180ms 16.82% 36.45%      180ms 16.82%  math.archExp
     160ms 14.95% 51.40%      670ms 62.62%  math.pow
      80ms  7.48% 58.88%       80ms  7.48%  internal/chacha8rand.block
      70ms  6.54% 65.42%       70ms  6.54%  math/rand.globalRand
来认识一下这五个指标:
| flat | 是我们最关注的指标,它代表自身耗时,不包含内部调用。 |
| falt% | 自身耗时相对于总耗时的百分比 |
| cum | 自身耗时加上内部函数调用的总耗时 |
| cum% | 自身耗时加上内部函数调用的总耗时相对于总耗时的百分比 |
| sum% | 前 N 行的 flat% 之和。对于上述例子的第四行 58.88=19.63+16.82+14.95+7.48 |
只是依赖文字无法很好的理解这些指标,我们可以使用 web 命令来生成更直观的 svg 分析图。输入 web 命令后,会自动在浏览器打开 svg:
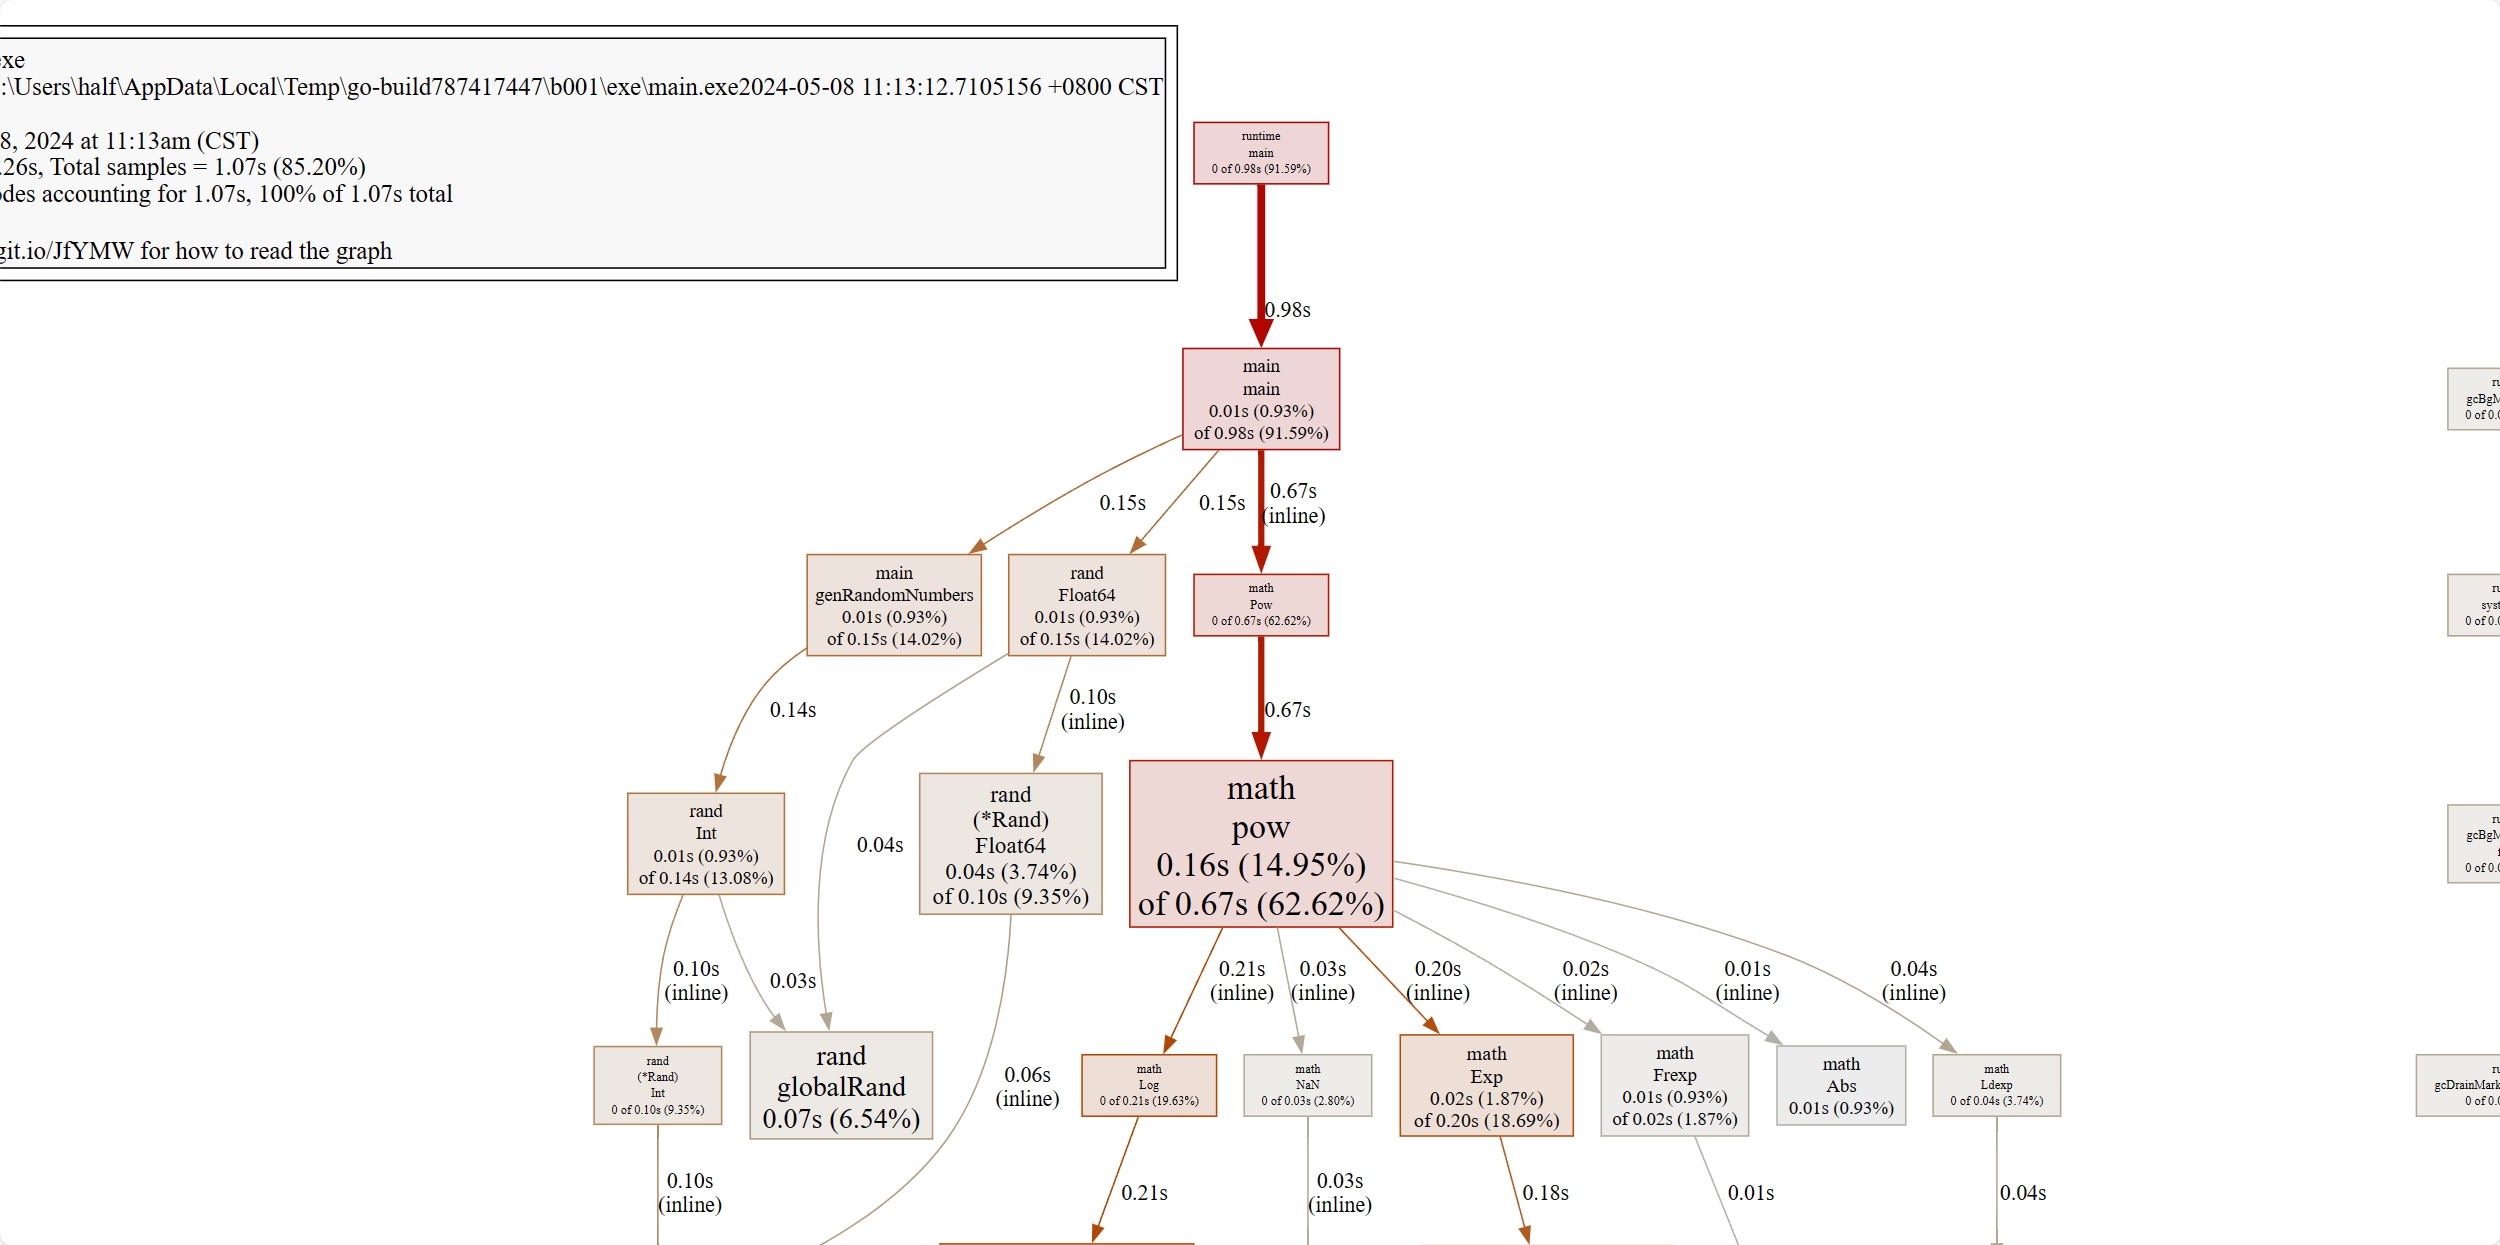
svg 中的每个单元格包含了包名,函数名,flat, flat%, cum, cum% :

单元格颜色越红,代表 cum 越大,反之越小;单元格越大,代表 flat 越大,反之越小。单元格之间的箭头线代表调用链,线越粗代表消耗的更多的资源,反之亦然。带有 inline 字段表示该函数被内联进了调用方(当作普通线处理就行)。
函数调用是存在一些固定开销的,例如维护帧指针寄存器BP、栈溢出检测等。因此,对于一些代码行比较少的函数,编译器倾向于将它们在编译期展开从而消除函数调用,这种行为就是内联。
更多的 Web UI
通过 web 命令已经可以获取很直观的性能分析图,我们还可以使用 -http 参数来启用一个 web 服务,获取更多的性能分析。输入 exit 退出 pprof 命令界面,输入命令:
go tool pprof -http=:7000 cpu.pprof之后会自动在浏览器打开 http://localhost:7000/ui/。
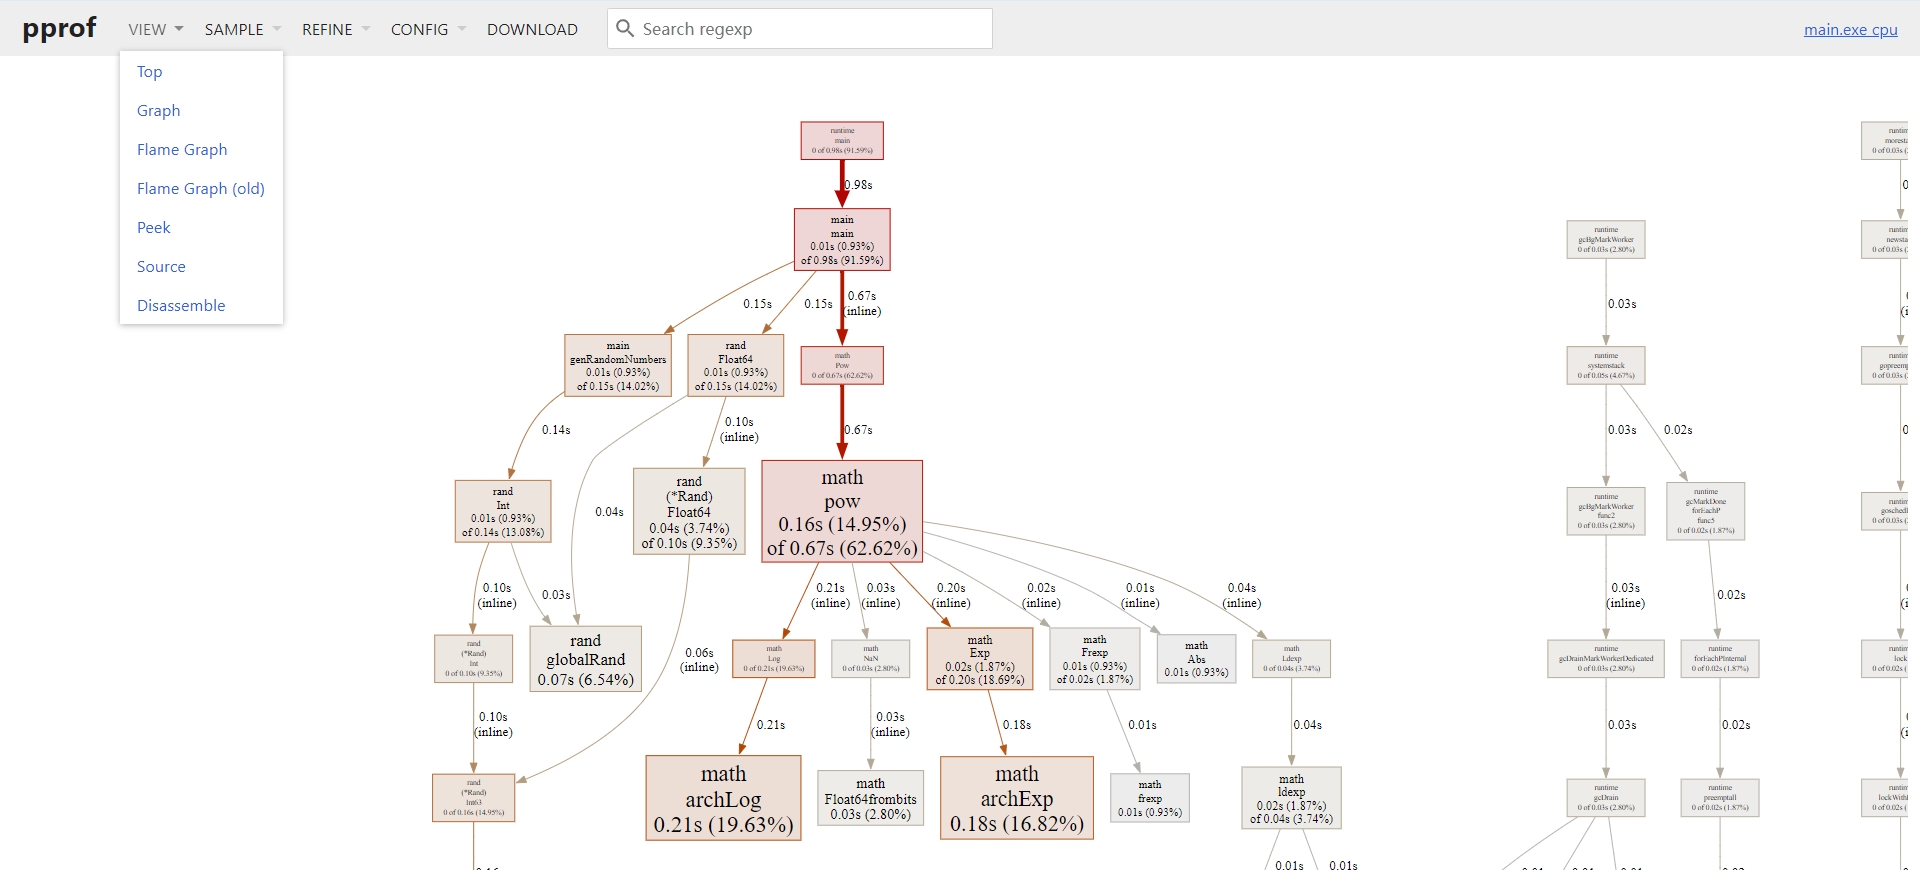
在 view 中可以使用火焰图(Flame Graph),火焰图有新旧两种,可以根据线的长短和颜色判断 CPU 耗时。其他的选项可以点点看看,不复杂,很容易就学会了。

web 服务采样
对于 web 服务的 pprof 采样,我们可以使用基于 runtime/pprof 封装的更便捷的 net/http/pprof 包。
package main

import (
	"fmt"
	"math"
	"math/rand"
	"net/http"
	_ "net/http/pprof"
)

func main() {
	http.HandleFunc("/", func(w http.ResponseWriter, r *http.Request) {
		// 测试程序
		for i := 0; i < 1000; i++ {
			nums := genRandomNumbers(10000)
			for _, v := range nums {
				_ = math.Pow(float64(v), rand.Float64())
			}
		}
		fmt.Fprint(w, "Hello, world!")
	})
	http.ListenAndServe(":8080", nil)
}

// 测试程序,生成一个随机数切片
func genRandomNumbers(n int) []int {
	nums := make([]int, n)
	for i := 1; i < n; i++ {
		nums[i] = rand.Int() * n
	}
	return nums
}
打开 http://127.0.0.1:8080/debug/pprof/ ,可以看到 pprof 的实时采样数据:
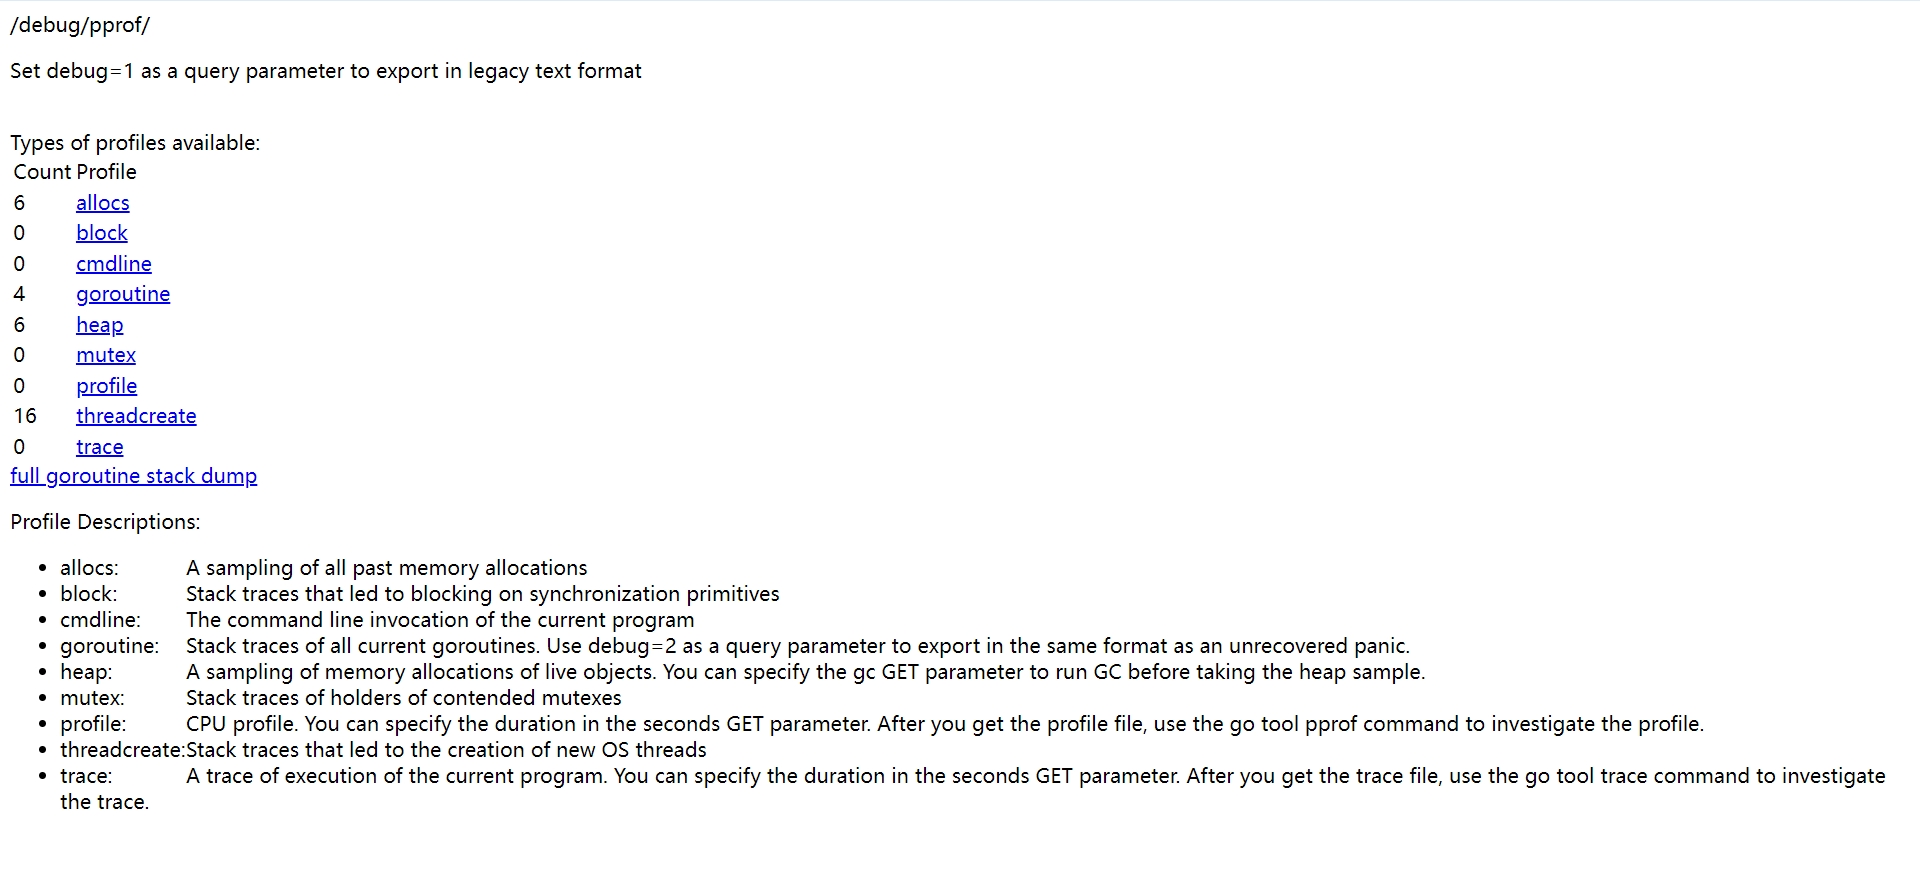
这里面一共有九个采样数据:
| allocs | 查看历史累计的所有内存分配的采样数据 |
| block | 查看历史累计的导致同步原语阻塞的堆栈跟踪 |
| cmdline | 包含进程的完整命令行信息,通常用于记录程序启动时的命令行参数 |
| goroutine | 实时查看当前所有运行的 goroutines 堆栈跟踪 |
| heap | 实时查看活动对象的内存分配情况 |
| mutex | 查看历史累计的导致互斥锁的竞争持有者的堆栈跟踪 |
| profile | 进行 30s 的 CPU Profiling,浏览器会转圈,30s 后下载一个分析用的 profile 文件 |
| threadcreate | 查看创建新 OS 线程的堆栈跟踪 |
| trace | 程序执行 trace, 和其他样本数据不同的是,这个需要使用 go tool trace 来分析。trace 是一种更详细的性能分析工具,用于跟踪程序的执行过程,包括函数调用、协程切换等。 |
默认是不追踪 block 和 mutex 的,如果需要,在代码中加入这两个:
runtime.SetBlockProfileRate(1) // 开启 block
runtime.SetMutexProfileFraction(1) // 开启 mutex
这些信息都是实时变化的,刷新一下浏览器即可看见,但是这些信息不易阅读,我们可以把它们下载下来,使用 pprof 分析,以 allocs 为例:
// 下载 allocs 数据
curl -o allocs.pprof http://localhost:8080/debug/pprof/allocs
// pprof
go tool pprof .\allocs.pprof
非 Web 程序的其他采样
在快速开始部分已经介绍了 CPU 采样,对于其他采样,可以参考这段代码:
package main

import (
	"math"
	"math/rand"
	"os"
	"runtime/pprof"
)

func main() {
	// 保存 CPU 采样数据
	file := "allocs.pprof"
	os.Remove(file)
	f, err := os.OpenFile(file, os.O_CREATE|os.O_RDWR, 0644)
	if err != nil {
		panic(err)
	}
	defer f.Close()

	// 测试程序
	for i := 0; i < 1000; i++ {
		nums := genRandomNumbers(10000)
		for _, v := range nums {
			_ = math.Pow(float64(v), rand.Float64())
		}
	}

	pprof.Lookup("allocs").WriteTo(f, 0)
}

// 测试程序,生成一个随机数切片
func genRandomNumbers(n int) []int {
	nums := make([]int, n)
	for i := 1; i < n; i++ {
		nums[i] = rand.Int() * n
	}
	return nums
}
本文目录